This article is part of the VMware vSphere Health Check PowerPack. More info can be found here: VMware vSphere Health Check PowerPack
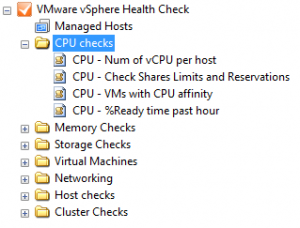
When opening the VMware vSphere Health Check PowerPack, you’ll see a number of CPU checks that will be performed. Let’s see what these checks do:
vCPUs per host
With this check we’ll be looking at how many vCPUs are used per host. To see if this host is ‘healthy’ I compare the number of vCPUs that are in use by the VMs to the number of logical CPUs available in the host. Using the ‘rule of thumb’ of 6 vCPUs per physical core or logical CPU, I check to see if the number of vCPUs is below 6 times the number of logical CPUs on the host.
Check Shares, Limits and Reservations
It often happens that because of templates with incorrect settings or changes afterwards, the CPU and Memory settings for shares, limits and reservations are not at the default value. The default values are:
– CPU shares at normal is 1000 shares per vCPU.
– Memory shares at normal is 10 shares per MB. A VM with 2048MB RAM will have 20480 RAM shares when at normal level.
– CPU / Memory reservations are at zero when using the default value.
– CPU / Memory limits are set to unlimited when using the default value.
Setting these values at different values should only be done when you know what your are doing. An often made mistake is playing with memory limits which can have a really big negative impact if you don’t know how limits work. Also have a look at this post of mine about some GUI issues in the vSphere client: VMware vCenter 4.1 GUI issues on shares.
When watching the results you’ll see a number of columns that are important:
- Attention
- CPU Res OK
- CPU Limit OK
- CPU Shares OK
- Mem Reservation OK
- Mem Shares OK
- Mem Limits OK
When there is a value of “YES” in the Attention column, this means that one or more checks have ‘failed’. That is, the value found is not equal to the default value. You may have a good reason to not use the default value and if you do so, please write this down in your design and maybe also write this into the VMs note field.
VMs with CPU affinity
In the early days of VMware ESX 2.5, it sometimes happend that for Citrix or other heavy workloads, a CPU affinity was set. In ESX 3.x and later this certainly is NOT advisable. There a little to no reasons to use CPU affinity. This check shows you which VMs have a CPU affinity set.
%Ready value of vCPU
Ready time is an important value to check when a VM is having performance issues. The %Ready value displays the time this vCPU is waiting to be scheduled while it has tasks to run on the CPU. A %Ready below 4% is ok, between 4% and 9% is something you should look at (warning) and above 10% is definitely a performance impact for the VM (Alarm). Be aware that a VM that sometimes hits the 10% or more value doesn’t necessarily cause a problem, only sustained values of above 4%and above 10% cause problems.
The check that is performed is only a short period in time snapshot. Therefore when seeing high values here in this check, you should use vCenter and ESXTOP to dive deeper into this VM and determine if this was just a spike or a steady high value.
